In 2024, one customer drove nearly half our loads. In 2025, we deliberately rebuilt our customer base — today, our top 10 customers combined represent just 26% of revenue.
Revenue grew 71% from FY2024 to FY2025 on 84% higher load volume — broad-based growth, not a single large contract.
Every month of 2025 outpaced its 2024 counterpart in load count — growth was broad-based across the calendar year, not concentrated in one quarter.
In 2024, our top 10 customers accounted for 65% of revenue. We deliberately diversified in 2025 — today's top 10 represent just 26%, across 661 broker and shipper relationships.
Fleet and driver headcount both grew 45% in 2025, but productivity per unit grew alongside it — this was efficient growth, not just added trucks.
Near-complete collection on billed freight reflects disciplined operations and creditworthy broker relationships.
Expansion has been financed through operating cash flow and owner capital — a conservative structure that keeps leverage low and borrowing capacity fully available for the next stage of growth.
A capital contribution in early 2026 lifted total equity to $652K and total assets to $857K, positioning the company for its next growth phase.
Detailed balance sheet, cash flow, and customer-level P&L data are shared directly with lenders and leasing partners upon request — not published publicly. Reach our Accounting Team at (214) 452-5160 ext. 105, or payment@western-cargo.com.
Every month of 2025 outpaced its 2024 counterpart in load count. The back half of the year was especially strong — September through December alone generated over $2.18M, nearly 40% of the full year's revenue, as the expanded fleet and broker network reached full stride.
Source: Western Cargo FY2025 Annual Report — derived from company trip & dispatch records, Jan 1 – Dec 31, 2024 and 2025. Revenue reflects hauling rate plus accessorial charges billed.
Growth came both from actively winning new business and from deepening existing partnerships — not from a single anchor account.
661 broker and shipper relationships, anchored by some of the most creditworthy names in freight. Our top partners by 2025 revenue:









Top broker partners by FY2025 freight revenue. All broker names and marks are the property of their respective owners and indicate active carrier–broker relationships.
Behind every load is an operations stack lenders can underwrite with confidence — camera-verified safety, continuous compliance, dedicated fleet insurance, managed tolling, national fuel networks, and a professional back office.



















All partner names and marks are the property of their respective owners and indicate active vendor and service relationships.
Fleet and driver counts both grew 45% in 2025 — and productivity per unit grew alongside them. Revenue per truck, revenue per driver, and loads per truck all rose year over year, even as market rates per load softened industry-wide.
Truck and driver figures are utilization counts — every unit active at any point during the year (48 trucks, 58 drivers in 2025), not a single-day snapshot. Per-load rates eased in line with the broader freight market even as volume and share expanded.
Lanes remained concentrated in the high-volume corridors of the South, Midwest, and West. Texas, California, Ohio, Illinois, and Georgia were the top five origin states by load count in 2025 — major freight hubs and manufacturing / distribution corridors.
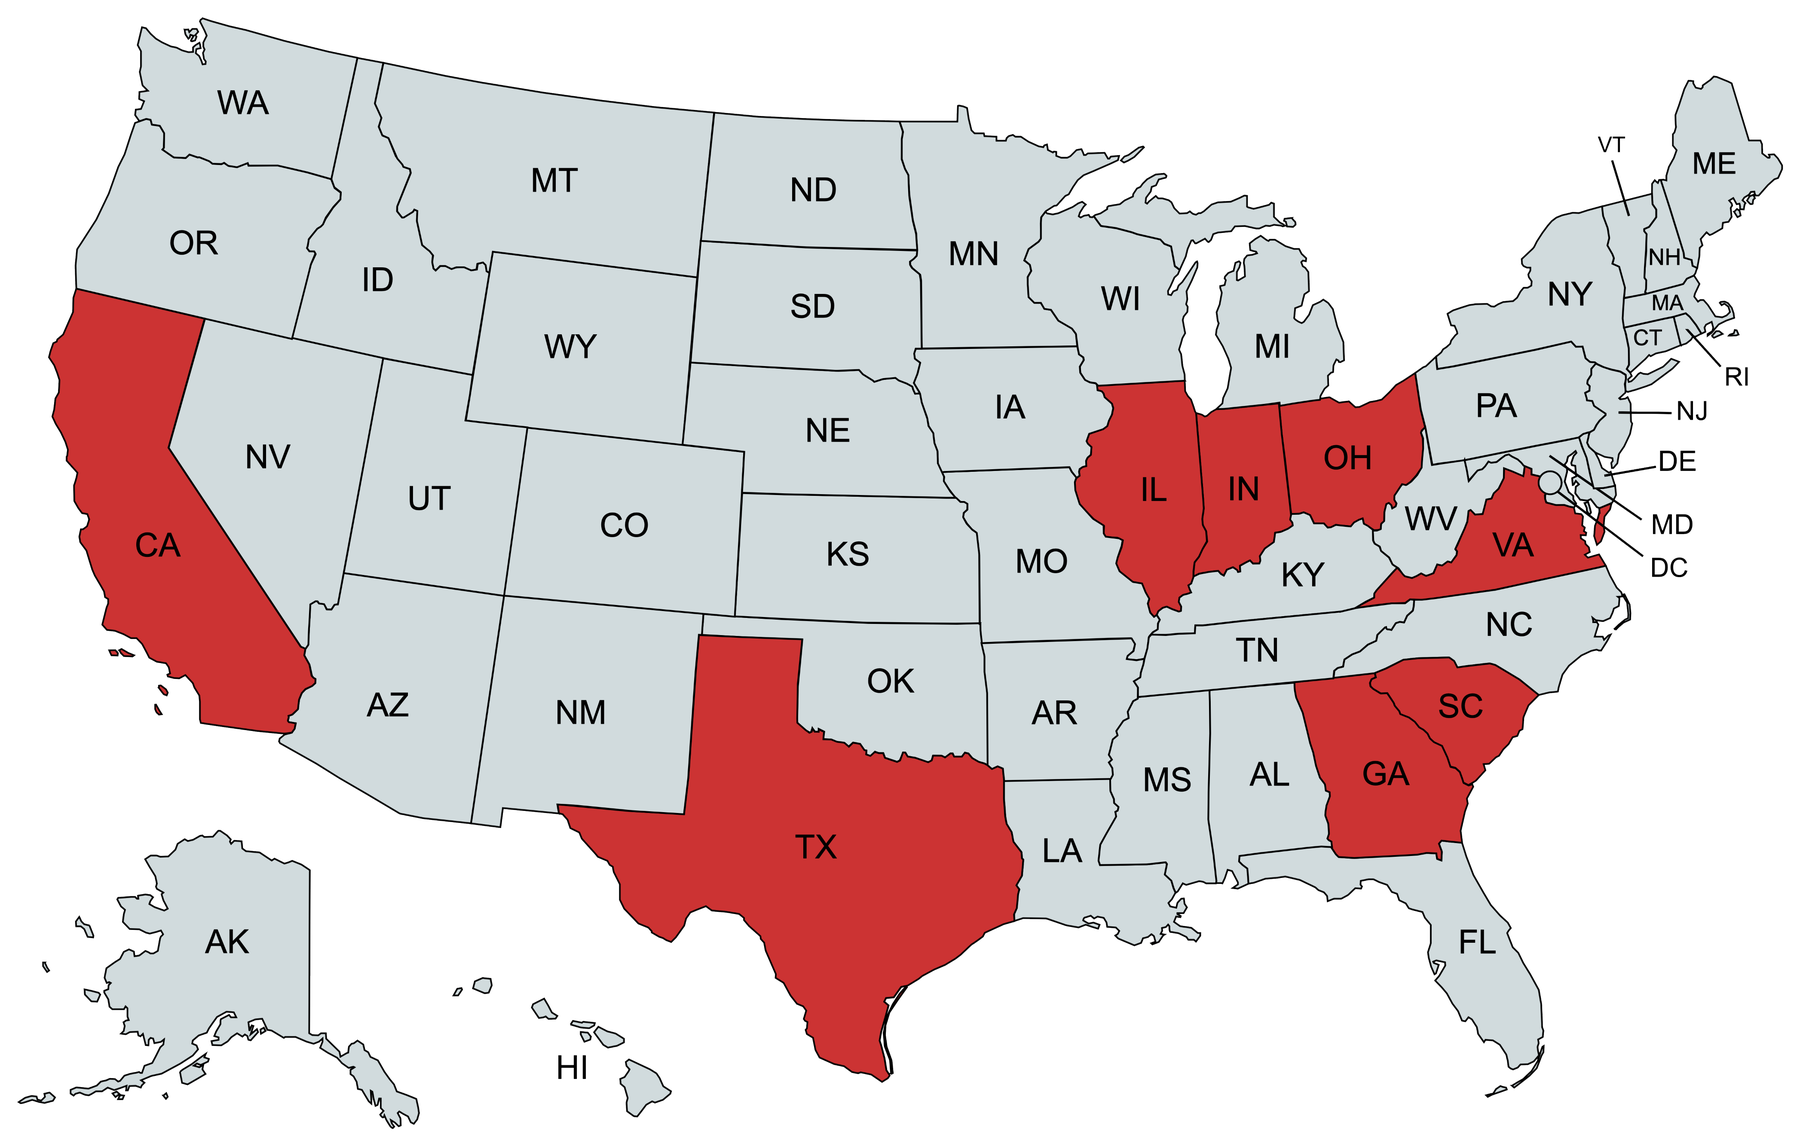
Loads originated by state, FY2025. Highlighted states on the map are the company's top eight origin states.